Click the title for the information, including the video presentation.
Bulk health monitoring
Monitor the health condition of all workers
It is a service designed for various kinds of factory, construction site, tunnel and other similar places, where temperature and heart rate information can “always” be “automatically” collected in “mass scale” to prevent heat stroke and to find fever person.
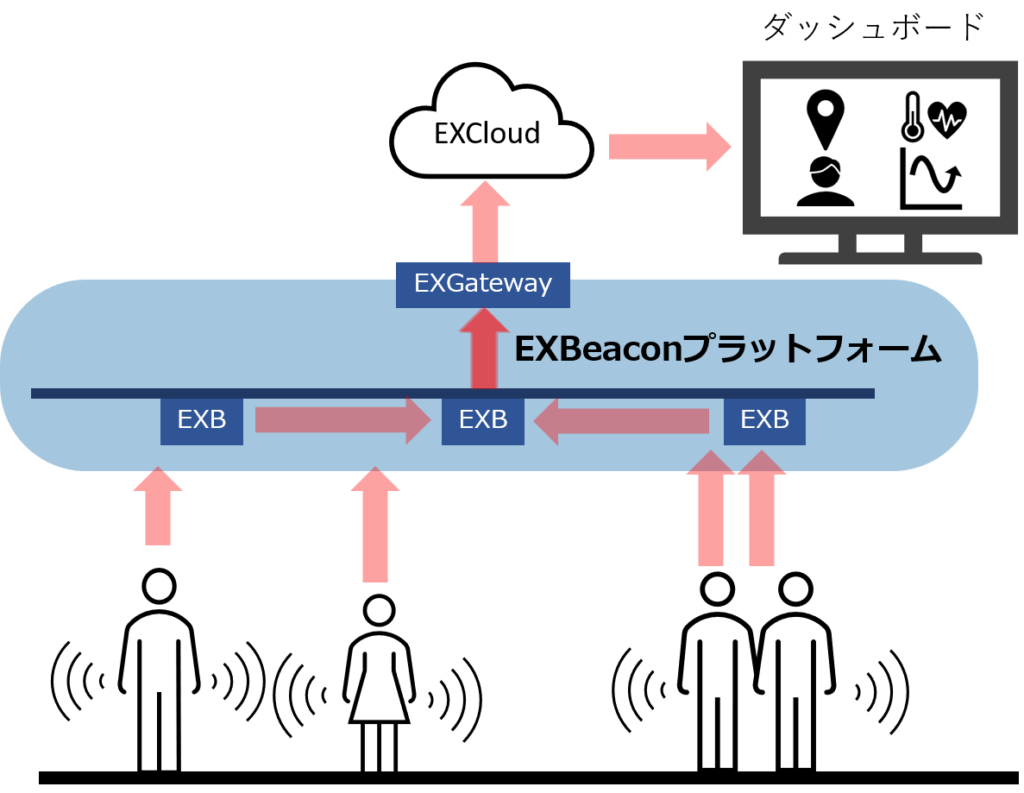
Structure of automatic health information collection
Workers ware the wearable terminal (EXVital) and the IoT infrastructure called EXBeacon platform constantly collects the health information from the terminal attached to the workers and uploads it on to the cloud to display the health information as well as the position information of each worker.
Generally, it is impossible for the wearable terminal to collect the information from the bulk of people at the same time. However, thanks to the advertised method, which doesn’t require the paring, EXVital is possible to collect the information from bulk of people, constantly, at the same time and automatically.
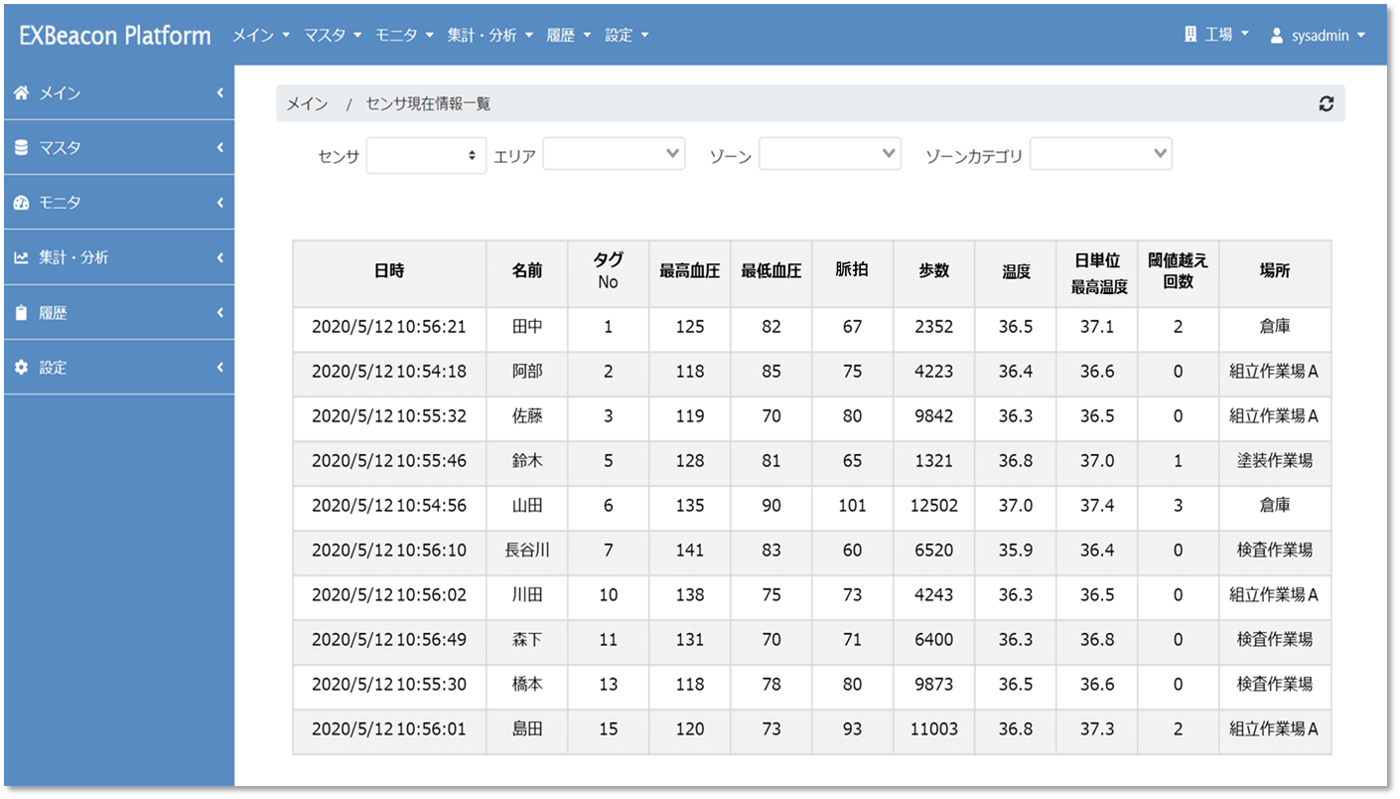
Health information of workers displayed on the dashboard
Collected health information can be seen on the dashboard. Various information is shown individually. Also available is sorting by group, age and property, and the search by worker is possible.
Further more, pinpointing the suspicious worker on the indoor map on the dashboard is also possible.
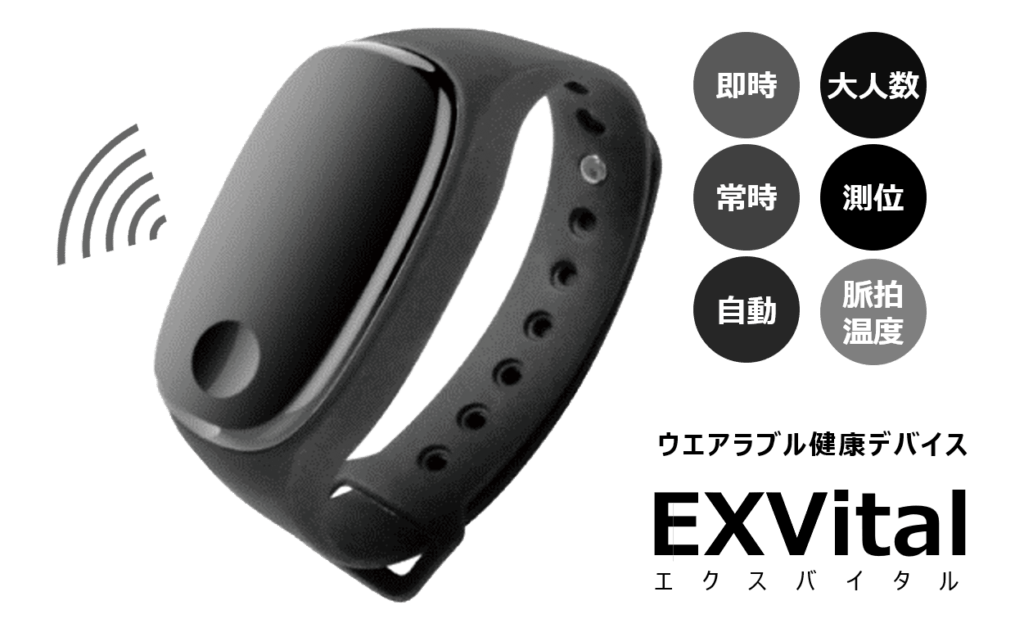
EXVital
Monitoring the health condition in this way makes it possible to report immediately the problem with the worker and his/her location to the managers and issue an alert.
It is battery operated with the retention of 3 days in regular use. It can be longer, if real time position data collection is not used.
What the worker wears is “EXVital”, a wearable terminal device developed by WHERE with high spec sensors.
EXVital can be put around the arm as well as a wrist. It is very handy for the cases that something at the wrist can damage the goods or prevent the smooth hands operation.
Price
It is also able to measure the pulse and detects the rise as the possible sign of the heat stroke. It also visualizes the amount of activity of the day, based on the number of steps.
JPY9,800/unit (w/o tax)
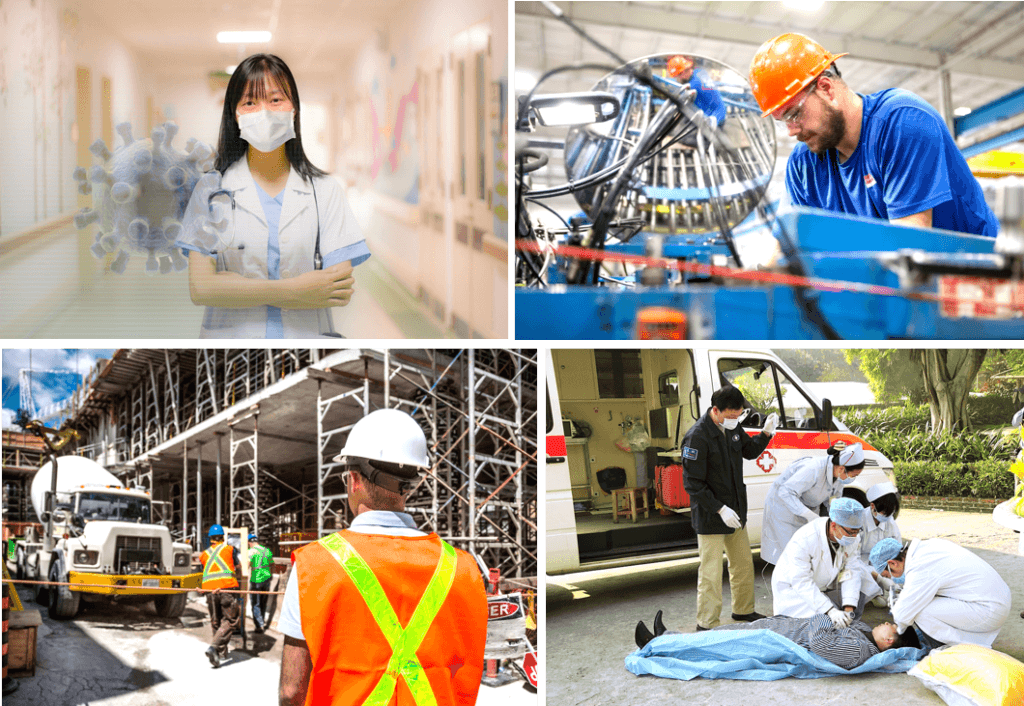
Use cases at the factory and construction site
This service provides health condition management of the worker based on the sensor data, not just a self-reporting.
Sign of the change in the worker’s health condition can be detected timely by continuous data collection. It helps to proceed the job as planned, avoiding the sudden lack of man power.
To cope with the COVID-19 threat, constant thermometry and a face mask are highly recommended, but the risk of heat stroke would increase by wearing a mask all the time. Our solution is useful for this difficult situation, especially for the workers at the factory or the outdoor construction site.
Simple WBGT measurement system
What is WBGT?
Do you know WBGT, which is more relevant than temperature as the heat stroke indicator?
WBGT was advocated in the USA in 1954 as the indicator to prevent the heat stroke and is regarded more important than temperature.
It shows if WBGT exceeds 28℃, the number of heat stroke patient sharply increase.
Simple WBGT measurement system
Simple WBGT measurement system is to visualize WBGT on real-time basis, which is simply calculated by humidity and temperature information.
IoT infrastructure called EXBeacon platform constantly collects the data from BLE humidity/temperature sensors deployed over the construction site or inside the house, and it makes WBGT available on real-time basis.
Dashboard
Measurement result of WBGT is displayed on the dashboard.
It is available in the way of showing WGBT, according to the place and time or displaying the heat stroke risk in 4-levels per area.
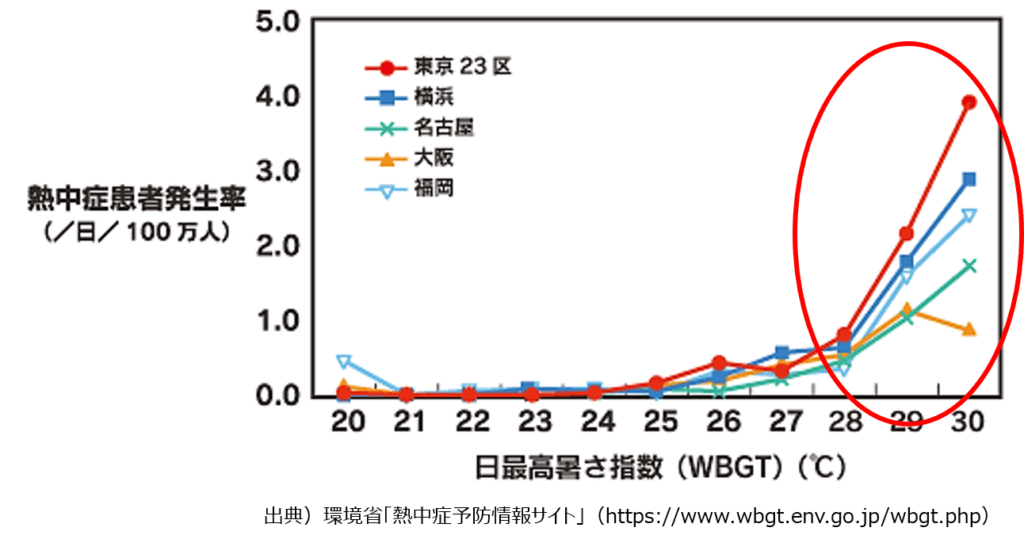
Occurrence ratio of the heat stroke patient and WBGT

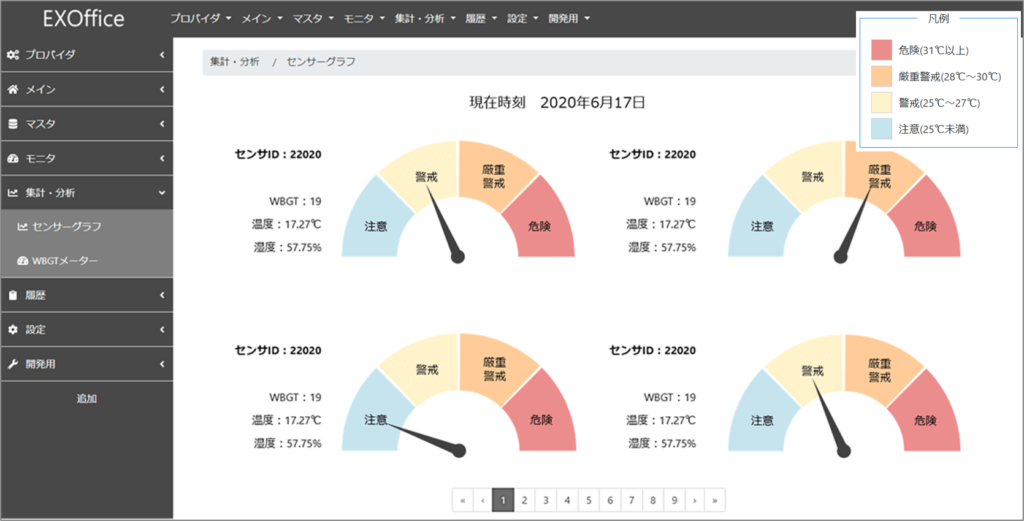
Sensor graph dashboard
Touchless entrance/exit security service
No more holding the card (over the device)
This is the smooth and secure way to go in/out by just carrying the card.
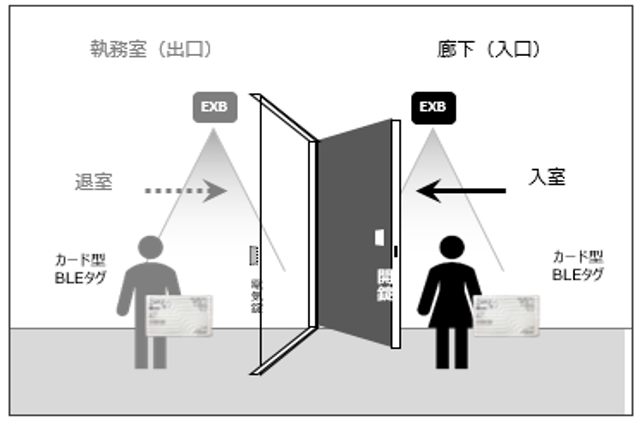
Most of the traditional security system is RFID type and requires to “hold” the card over the device set on the door or just next to the door.
However, this system utilizes the transmitter tag using bluetooth technology and assures the touchless going in/out, as if there is no door lock.
Various kinds of security tag
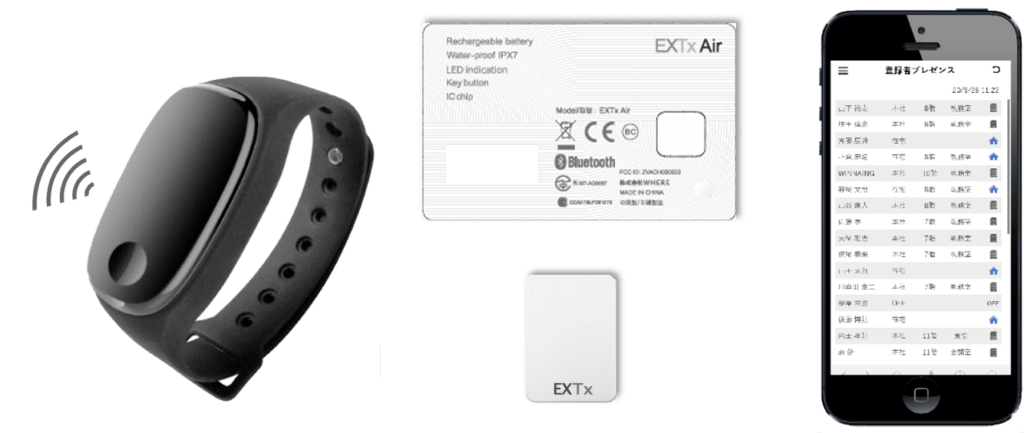
With this system, “BLE (Bluetooth Low Energy) tag” is used instead of traditional security card.
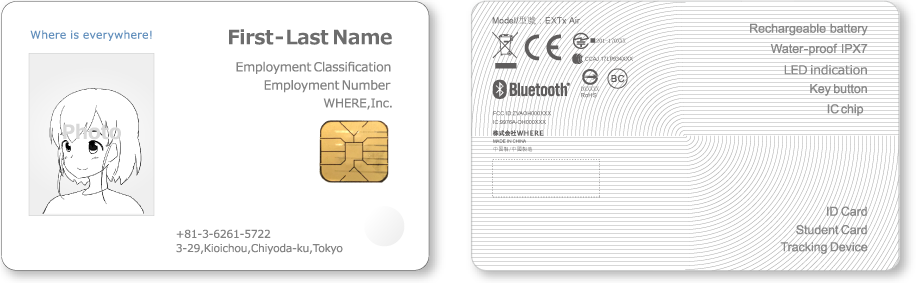
Various kinds of tag are available from WHERE; ultra-thin card type (EXTx_Air), the one with coin battery and a wareable device with heath-care sensors (EXVital).
Hardware from other manufacturers can be used, too.
Card-type BLE tag
Various kinds of BLE tag
Cooperation of BAS and EXBeacon platform
Electric wave from BLE tag carried by the employee is detected by EXBeacon platform for security authentication and at the same time, it works with the building management system such as BAS (Building Automation System: Central monitoring system) to control electric lock system.
Further more, used with PIR sensors, it realizes high-precision security system to reflects the sensitive movement of the people in the door area.
On a large premises, a couple of different management systems tend to be required due to a number of exits, entrances and doors. It makes employee to carry different tags for authentication, which is ineffective.
EXBeacon platform deployed all over the building makes it possible to manage complicated entrance/exit system with just one single card.
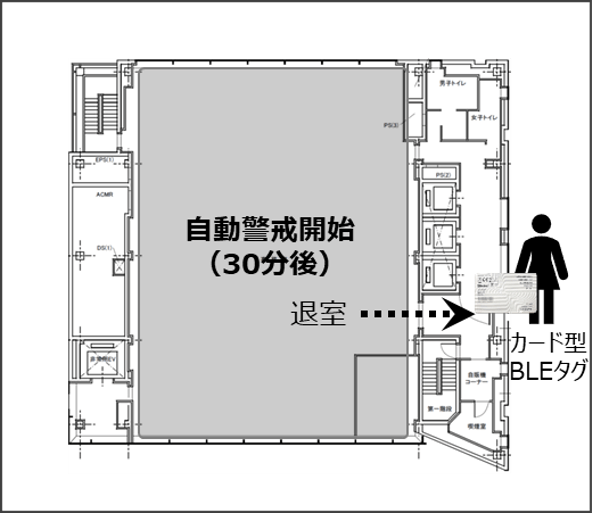
Automatic machine vigilance cooperation
RFID type requires card-leader operation for the last people when going out of the building.
However, with this system machine vigilance starts automatically 30 minutes after the last detection of the BLE tag. It is handy and prevents the trouble caused by forgetting to check out with the card reader.
System structure

Automatic machine vigilante cooperation system
High-risk Contact Tracking / Contact situation analysis
High-risk Contact Tracking
If some one in the office gets infected…
Clearly indicates who he/she contacted, when and where!
Even though declaration of a state of emergency has been cancelled, it is highly recommended to prepare for the second or third outbreak of Covid-19. EXOffice is the service that aggregates employee’s close contact data, and this time “High-risk Contact Tracking” was just added in the service line-up.
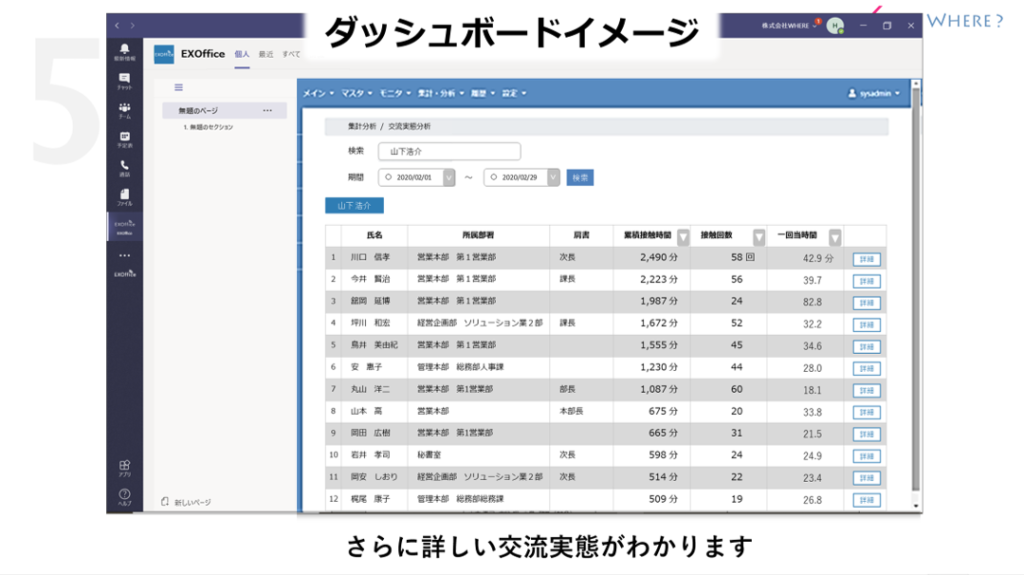
This is the tool, useful in the case like happening of COVID-19 infection in the office, that analyzes the contact history of the employee based on the position data collected by EXOffice to get the detailed track data of people using his/her contact log.
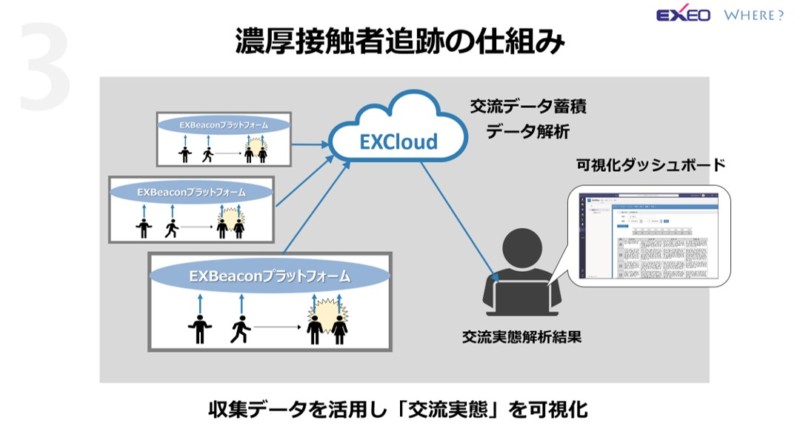
First, introduce EXOffice in the office area. EXOffice constantly collects the contact data of employee and stores in the database. If it examines this database, then it tells who contacted who.
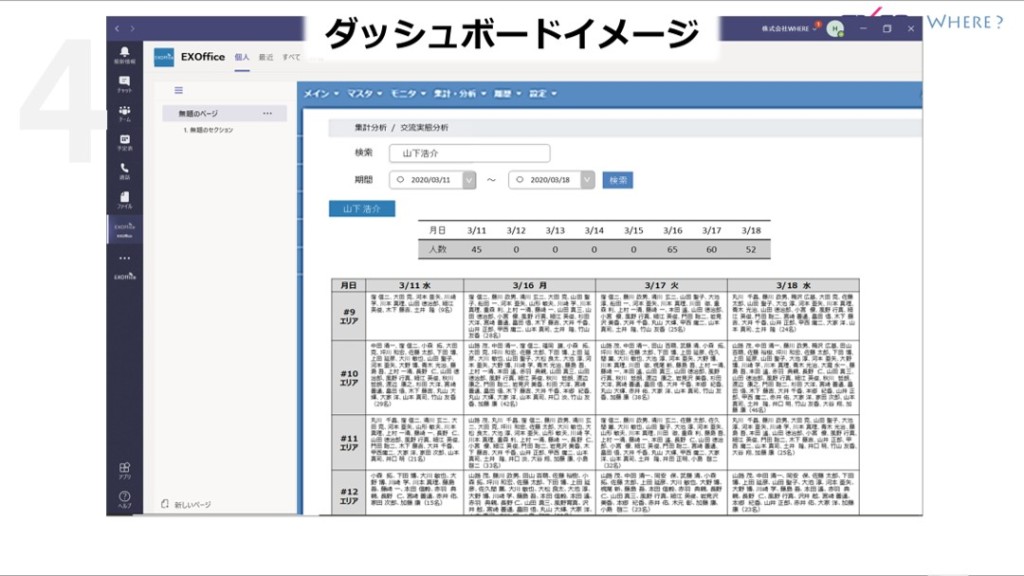
This dashboard image shows the search result by name and the period. It clearly presents “who” contacted “who” , “where” and “when”.
Understanding “High-risk Contact Tracking” in 3 minutes
Reference information: In-person contact situation analysis
It analyzes complicated in-person contact or organization structure based on the location data.
Close contact person tracking tool is one of the “Contact situation analysis” tools. EXOffice and EXBeacon platform introduced in the various premises constantly collects the people’s position data and operates contact situation analysis based on these data.
Flow of data and analysis
Massive raw data from BLE tag and various sensors are filtered to be stored in the IoT database as the readable probe data. WHERE visualizes those data on the dashboard and provides various tools for analysis as follows. Further detailed analysis results are available, if combined with the external BI or AI tool.

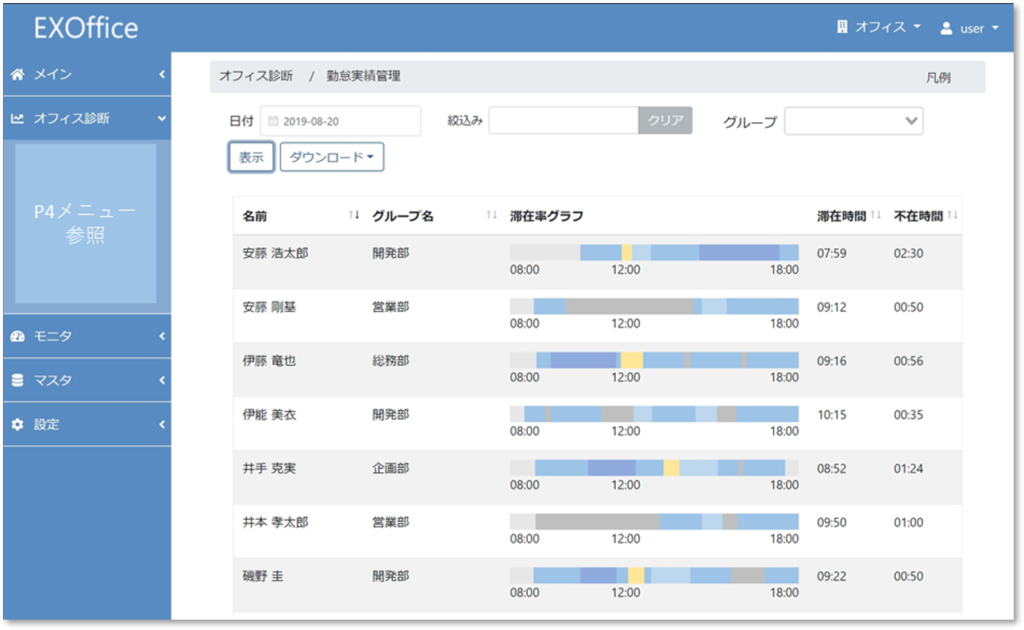
Office diagnosis
It performs the analysis, using the massive raw data stored in the IoT database, such as position data of people and things in the office and environment information.
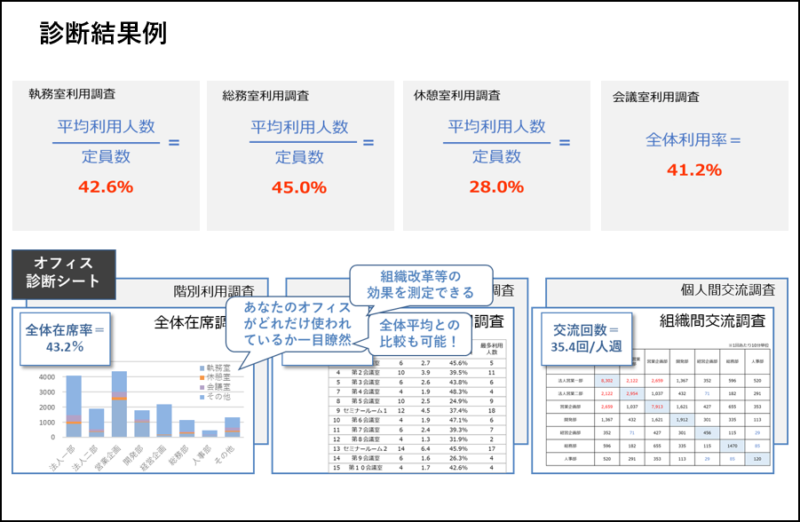
Office diagnosis is a simple analysis service obtained on the dashboard. It clearly shows the office usage ratio. Comparison against national average available, too.
If you use this service before and after the office layout change, for example, you will know the effectiveness of such change.
3 methods of analysis
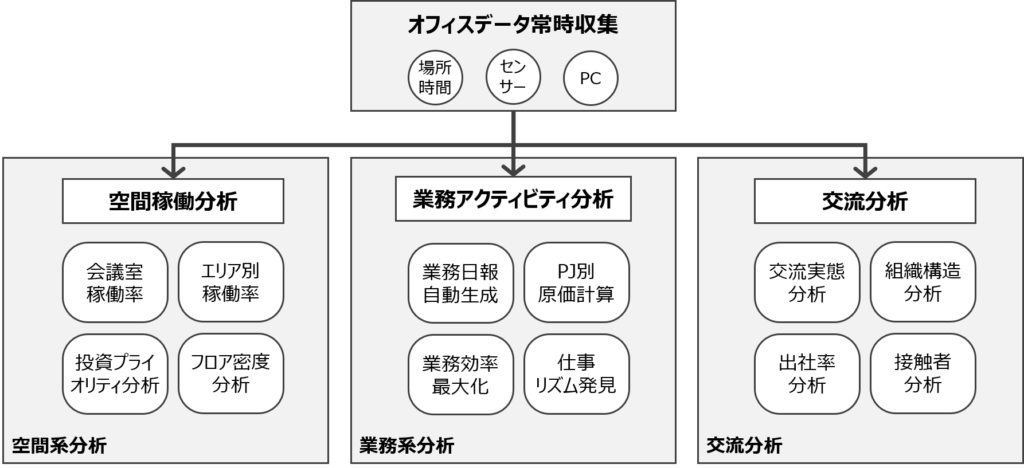
There are 3 different methods in “Office analysis” service.
First, “Office space analysis” to tell usage ratio per each office zone or the meeting room.
Second, “Operation analysis”, such as auto-generation of the daily job report.
And one more, “Contact analysis” to track the people’s contact or to check the department structure in the office.
Hoteling Support Service

What is “Hoteling”?
Hoteling is an on-demand work station (office) reservation and use system.
You can reserve the seat in advance to suite your job and work activity at the office.
It is rapidly collecting the interest as a way to use the office under New Normal, because it can assure the social distance and reduce the office space.
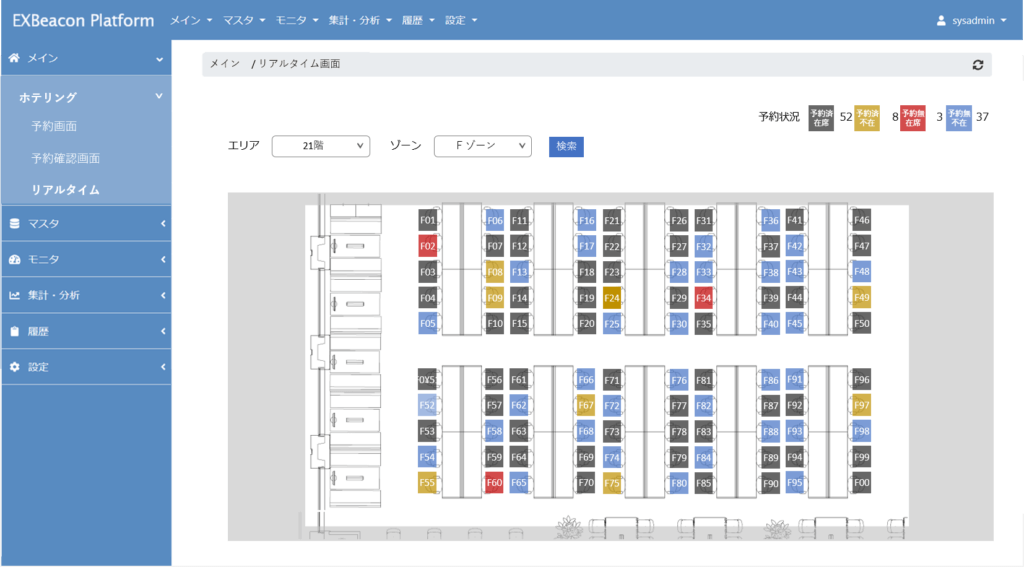
It provides the reservation as well as capturing the use status.
Traditional hoteling service only provides the reservation, but in WHERE’s case, it also collects the status information such as in-use or not, who’s using, and so on.
It gives the information much sought after such as reserved-but-not-in-use, or in-use-but-not-reserved.
Further more, analysis of the reservation information or use status information shows the individual way of use or usage ratio by the seat, and they are useful for the work place management such as the usage rule improvement and the seat layout change.
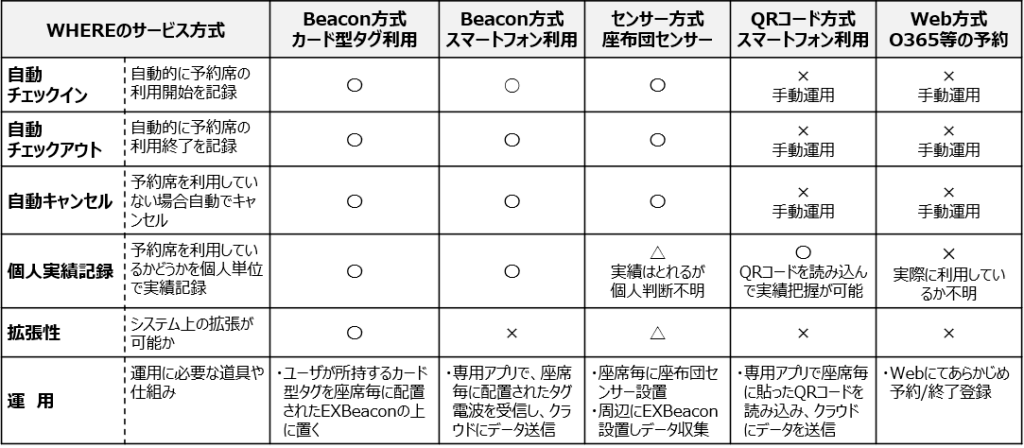
Auto check-in/out function
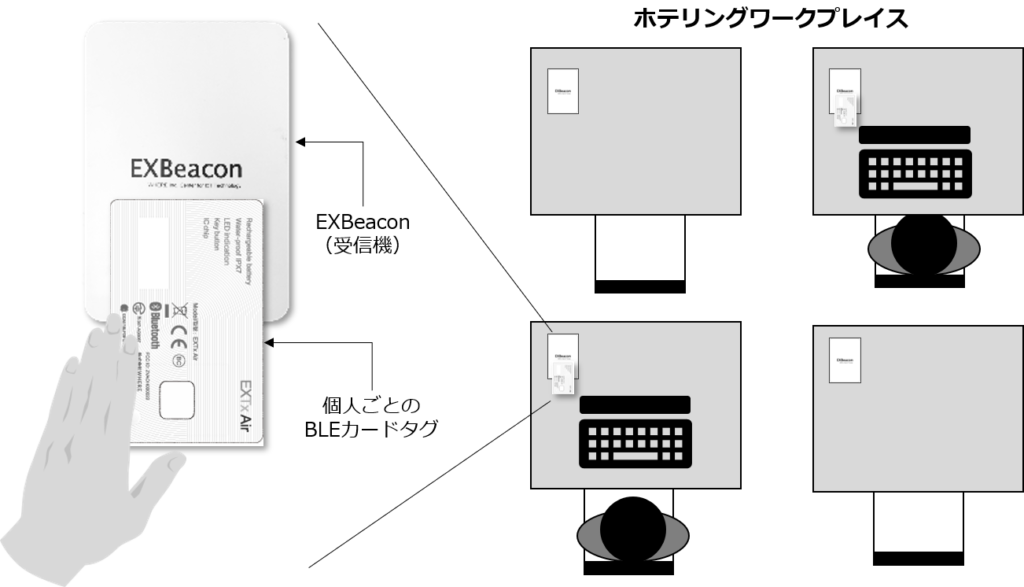
WHERE uses “Beacon method” and “Sensor method” out of various ways to capture the real usage status.
These methods features automatic check-in/out. Especially “Beacon method” is superior in capturing “who”, “when” and “where” used together with BLE tag that generates electric wave.
Fully-featured dashboard
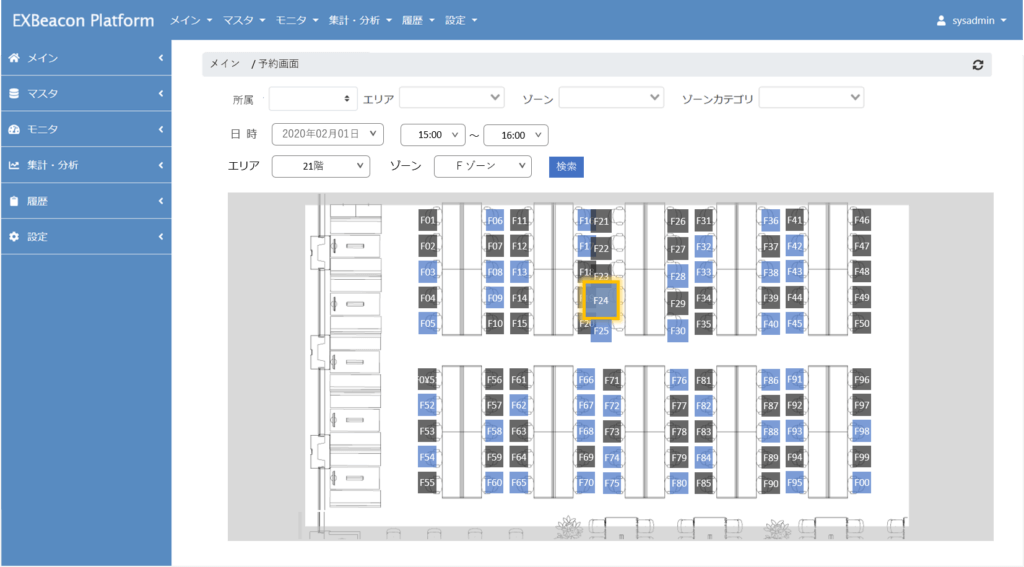
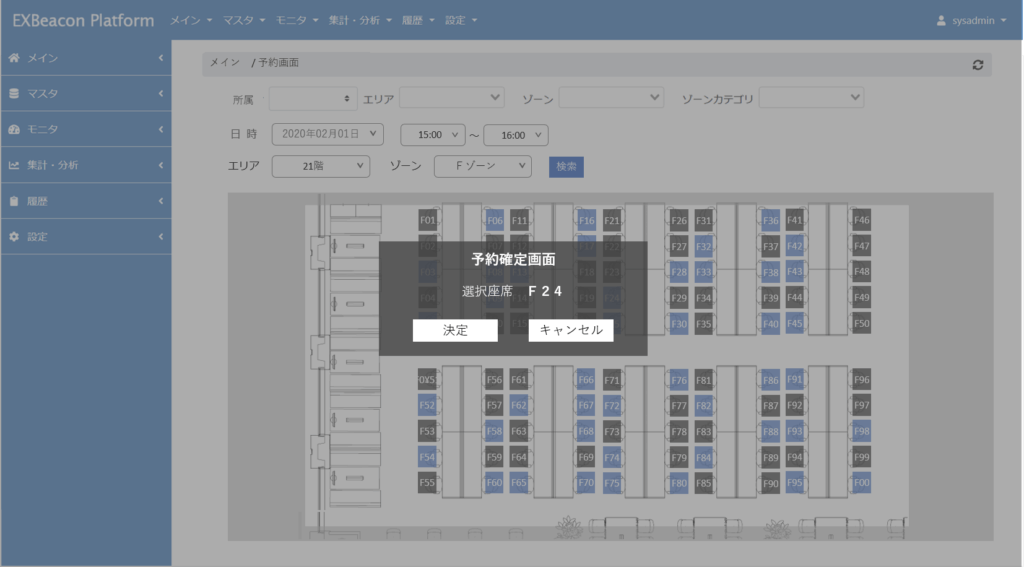
In the same manner to reserve the seat in a bullet train via internet, seat reservation is easily made on the indoor map displayed on the dedicated dashboard.
Checking the real time usage status on the dashboard shows irregular usage such as “reserved, but not used” or “in use without reservation”.
Smartphone as well as PC can be used to operate the dedicated dashboard.
Hoteling service comparison – now and then.

Beacon方式
Workplace management with EXOffice
- Hoteling service -
Attendance ratio/Office density visualization service
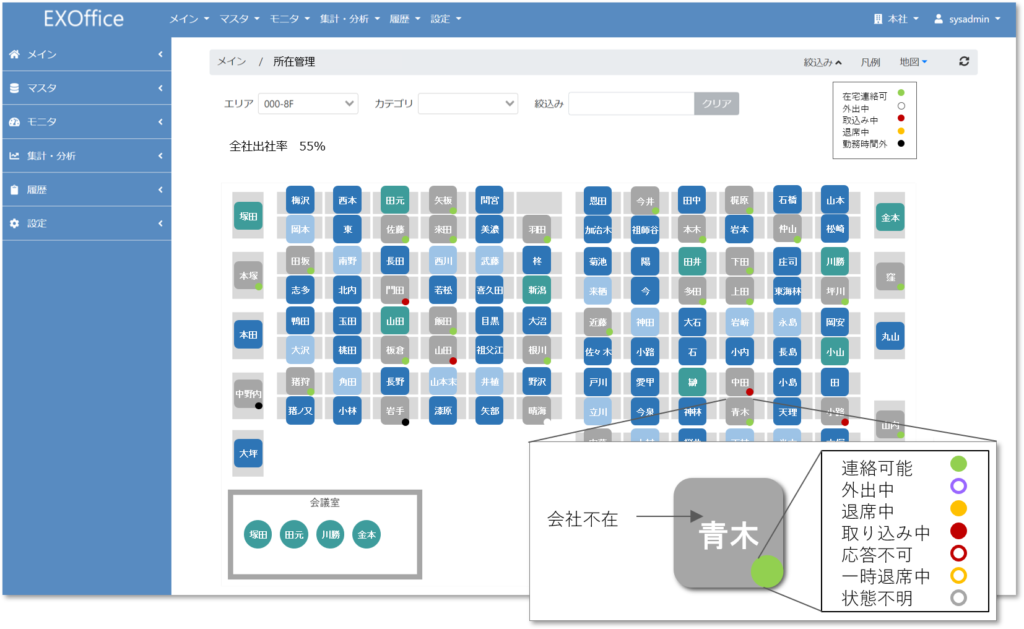
Attendance ratio: whole company/per department
This service is available in the office that has EXOffice installed and provides the attendance ratio in graphs in terms of whole office or per department.
Also available is the simple analysis, including comparison against previous day or the attendance history of the certain period.
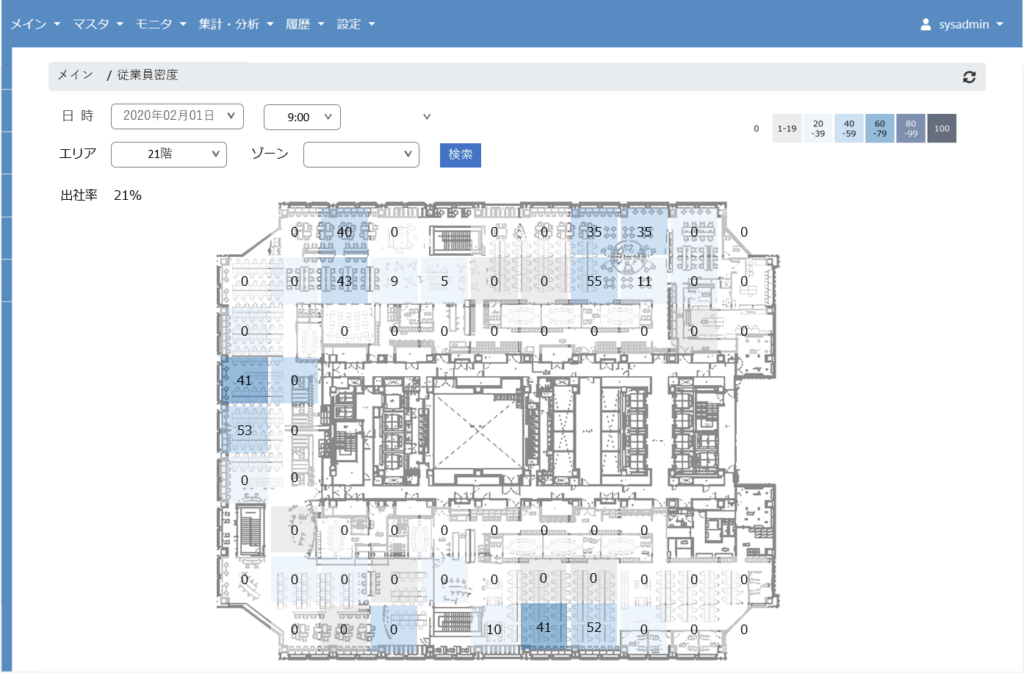
Visualize office density
Also available is the service to constantly measure and display the office density.
Density of pre-defined zone is measured in every several minutes and displayed on the indoor map, as it happens.
It makes possible to provide the seat choice in non-territorial office, avoiding too much density, because the office density is visualized on actual-time basis.
Measurement logic
IoT infrastructure called EXBeacon platform calculates the attendance ratio or office density by collecting constantly the electric wave from BLE tag carried by the employee.

Attendance ratio
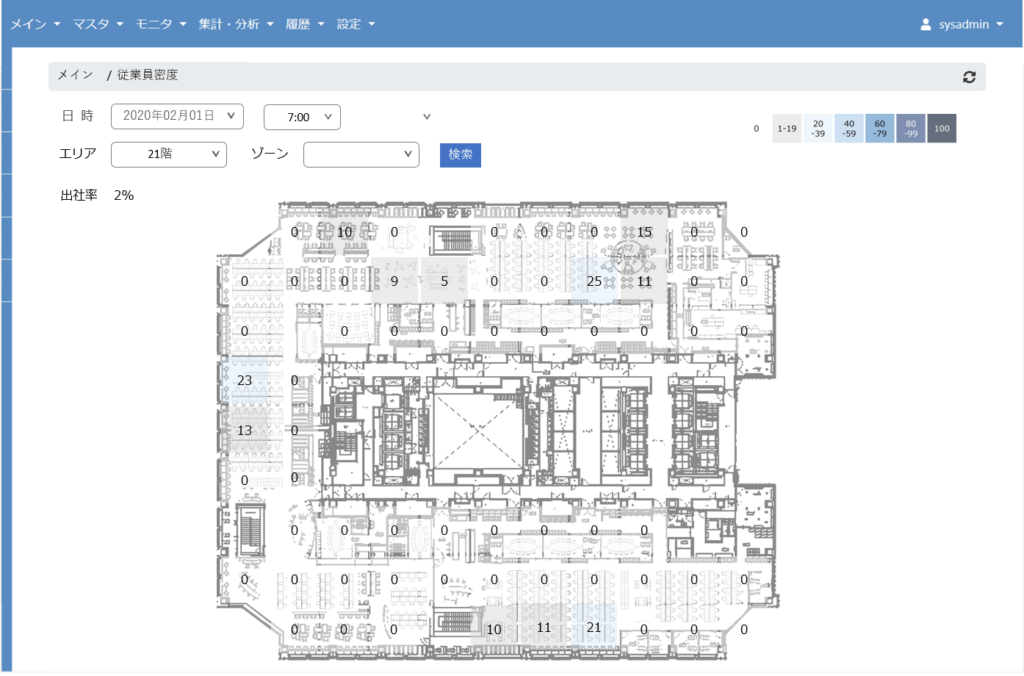
Office density (7:00/9:00/11:00)

Presence Board for Telework
Tool to make the work from home comfortable
Sort out the issues unique to the decentralized office
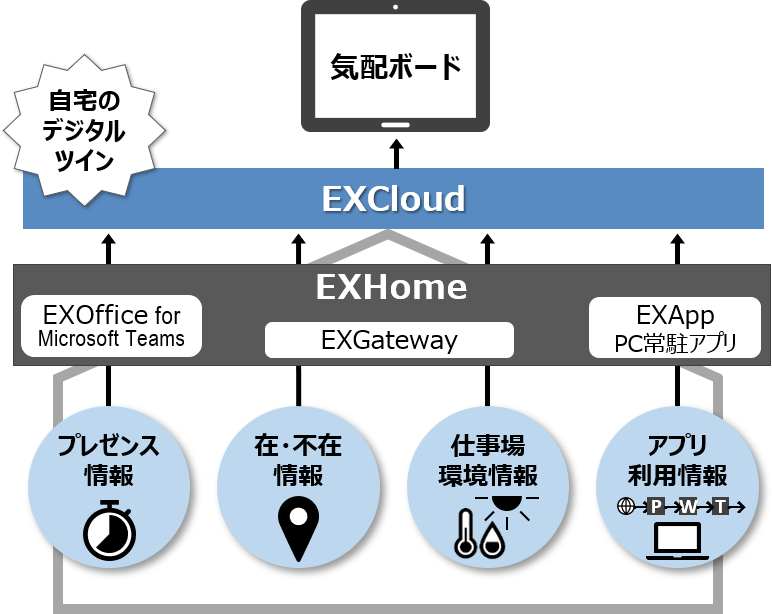
Presence Board is a dashboard of “EXHome”
Introduce “EXHome” in your place and realize digital twin of home by collecting various information related to teleworking (presence, attendance, work place environment, application use status).
Sharing your “presence” with your colleagues, managers and staff members to produce a relaxed sense of unity, while digitizing “work result” to generate daily report automatically and analyze the work contents to find out “work rhythm” of your own.
Presence Board for Telework sorts out the collected data, according to the purpose, and displays it in 5 different modes on the dashboard.
Presence overview screen
Daily report overview screen
Check the dedicated page for more information.